
The question
Wi-Fi fingerprinting is the workhorse of indoor positioning: walk a building, record the signal strength of every visible access point at known reference points, and later match live measurements against that map. It is cheap, it needs no new infrastructure, and it works, provided you stay on the device you collected it with.
Change the handset and the map degrades. Different antenna designs, chipsets, casings, and firmware-level gain control mean two devices at the same coordinate report systematically different RSSI vectors. The fingerprint database encodes not just where but what was holding the receiver.
Can a learned representation separate the part of an RSSI fingerprint that encodes location from the part that encodes the measuring device, so one survey remains valid across heterogeneous hardware?
Why RSSI is fragile in the first place
RSSI is measured at the MAC layer, which means the whole richness of the propagation channel is compressed into a single scalar per access point. That compression is what makes it universally available and also what makes it brittle:
- Low feature dimensionality. One number per AP leaves little redundancy to exploit when part of the signal is corrupted.
- High temporal variability. An immobile receiver can see RSSI vary by several dB over a single minute purely from small-scale fading.
- Hardware-dependent offsets. The mapping from received power to reported RSSI is vendor-specific and not standardised.
Classical fixes apply a per-device calibration constant. That helps with a pure offset but fails when the discrepancy is non-linear or varies with signal level, which, empirically, it does.
Method: learn the invariance, don't calibrate it
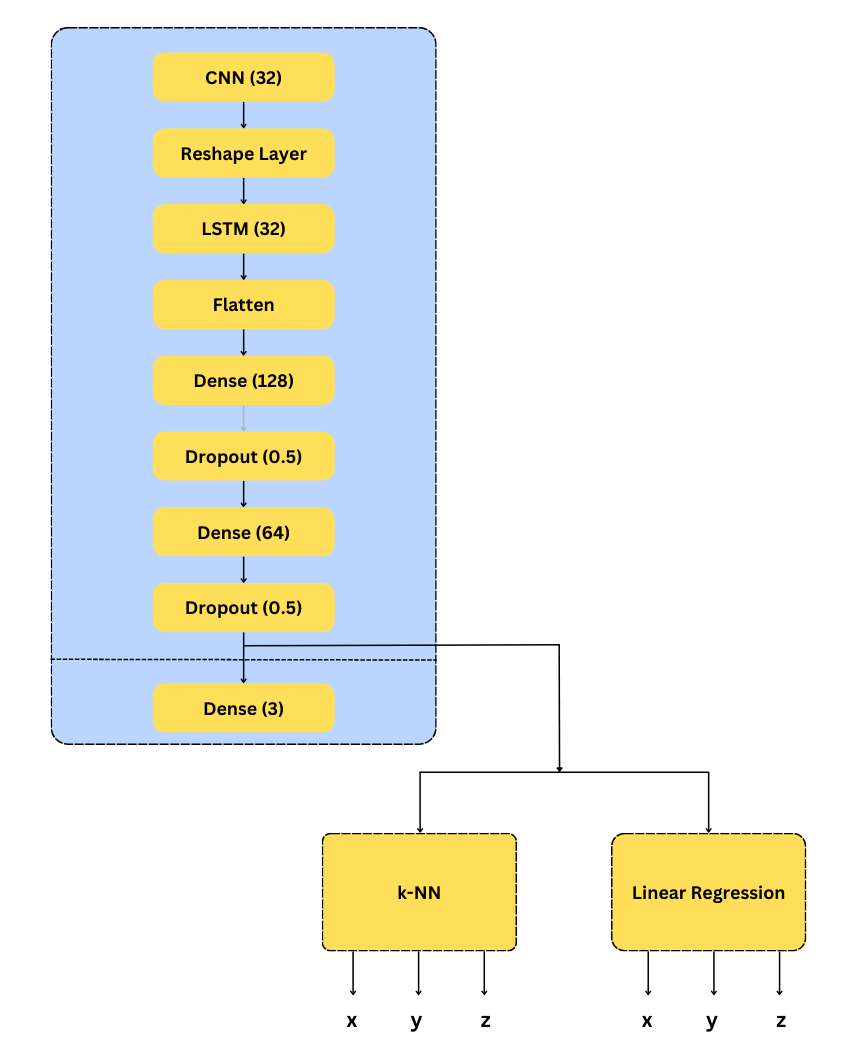
Instead of estimating a correction per device pair, the approach learns a representation in which the device signature is simply not encoded. A CNN-LSTM architecture handles the two structures present in the data:
Convolutional stage
Extracts spatial patterns across the vector of access-point readings, which APs are strong together is more device-stable than any single absolute value.
LSTM stage
Models the temporal sequence of measurements, so transient fading is averaged out by the architecture rather than by hand-tuned smoothing.
Deep feature learning for invariance
The network is trained so the learned embedding predicts position while suppressing device-specific variation: the representation carries location, not provenance.
Getting the data honest first
Public RSSI datasets are messier than their documentation suggests. Before any modelling, the pipeline runs an explicit exploratory and cleaning stage, and several of those checks exist because the exploratory analysis surfaced problems that would otherwise have silently corrupted the results.
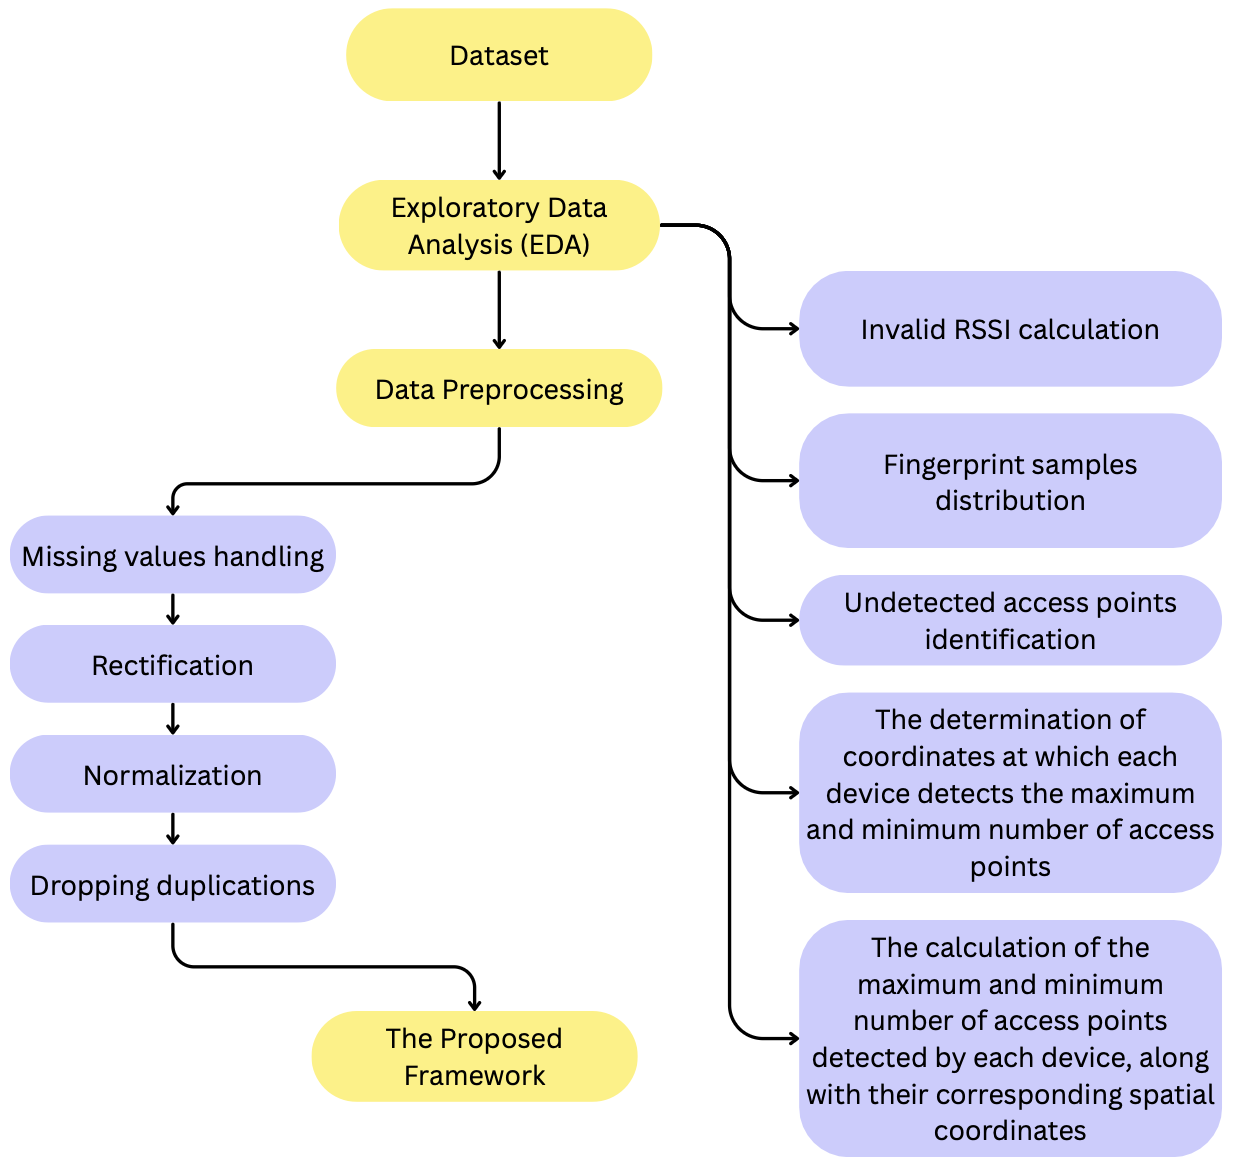
Identifying undetected access points and invalid RSSI values is not housekeeping. In fingerprinting, a "not detected" reading and a "very weak" reading are entirely different physical events that datasets often encode with the same sentinel number. Treating them identically injects exactly the kind of device-dependent bias this project set out to remove.
Experimental design
- Dataset. TUJI1: a public multi-device indoor positioning dataset with fingerprints collected across heterogeneous receivers, which makes the device-shift question directly measurable.
- Protocol. Cross-device evaluation: train on some devices, test on others, so the reported robustness is genuine transfer rather than memorisation.
- Metrics. 3D positioning error in metres, plus the change in error when moving across devices: the quantity that actually captures heterogeneity.
Results
The 0.17 m figure deserves the emphasis rather than the 2.20 m. Absolute error depends heavily on building geometry and AP density and is not very comparable across papers; the reduction in the penalty for changing device is the quantity this work set out to move, and it is measured under genuine cross-device transfer.
Per-device breakdown
Averages hide exactly the failure this project is about, so the comparison is reported device by device against a k-NN baseline using the Sørensen distance: a strong, standard fingerprinting matcher.
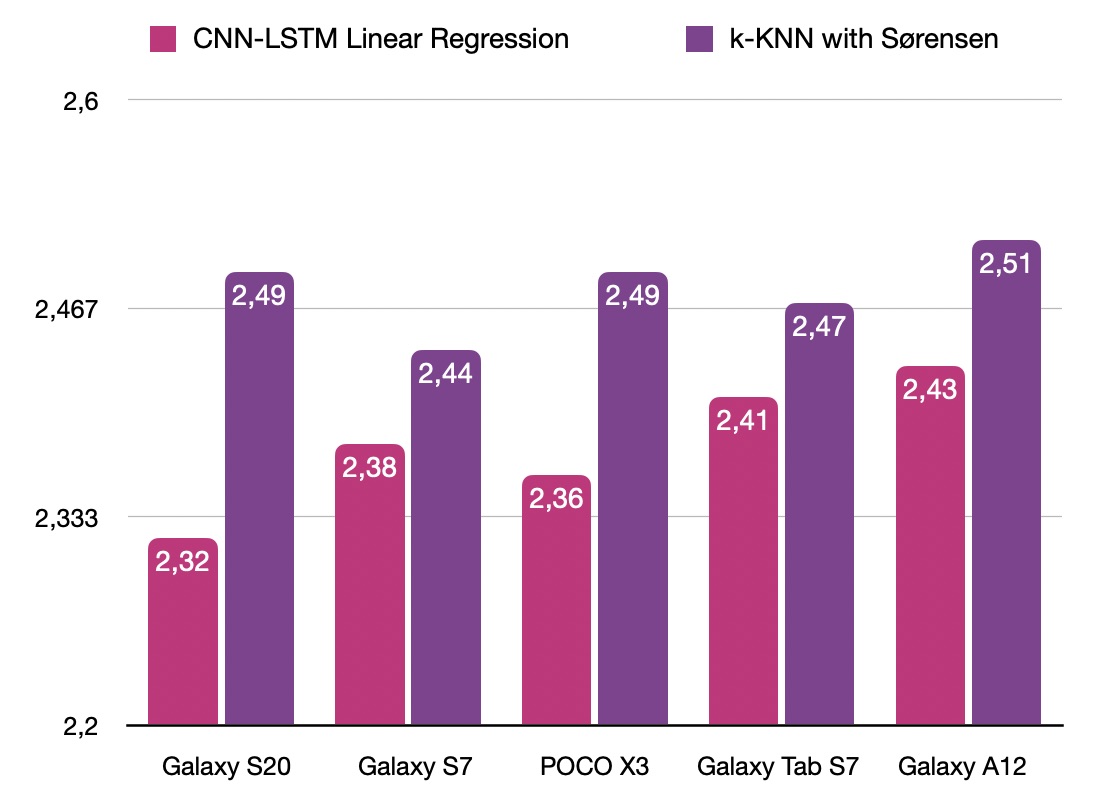
| Device | CNN-LSTM + Linear Reg. | k-NN + Sørensen | Δ |
|---|---|---|---|
| Galaxy S20 | 2.32 | 2.49 | −0.17 |
| POCO X3 | 2.36 | 2.49 | −0.13 |
| Galaxy S7 | 2.38 | 2.44 | −0.06 |
| Galaxy Tab S7 | 2.41 | 2.47 | −0.06 |
| Galaxy A12 | 2.43 | 2.51 | −0.08 |
Two things stand out. The proposed model is better on all five handsets, and its spread across devices is tighter (2.32–2.43 m, a 0.11 m band) than the baseline's (2.44–2.51 m). A narrower band across hardware is precisely what "device-invariant" should mean in practice: consistent behaviour regardless of which phone is holding the survey.
Is the difference real?
A gap of a few centimetres invites the obvious objection: is this noise? The distributions were compared directly rather than asserted from means alone.
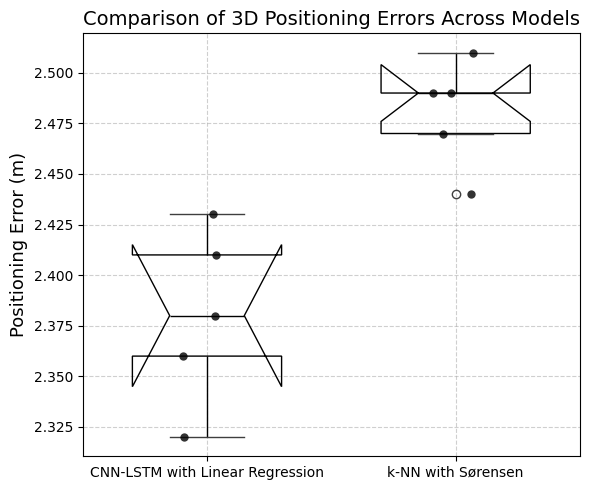
Non-overlapping notches are the visual equivalent of a significance test on the medians. Reporting this alongside the bar chart is deliberate: a bar chart alone shows a difference exists, but says nothing about whether it would survive resampling.
Limitations
- RSSI has an information ceiling. No representation learning recovers detail the MAC layer never exposed. This work pushes against a ceiling set by the measurement itself, which is precisely what motivated moving to CSI afterwards.
- Device diversity is bounded by the dataset. TUJI1 covers a specific set of receivers; genuinely novel hardware may shift in ways not represented in training.
- Temporal drift not addressed. This work isolates device shift. Day-to-day environmental drift is a separate axis, left for the CSI framework that followed.
- Offline evaluation. Results come from a recorded dataset, not a live deployment with real user motion.
Where it led
This project defined the research direction I have followed since. Two conclusions carried forward:
- Fight the shift, not the symptom. Per-device calibration is a patch; learning an invariant representation is a mechanism. That framing became the CORAL-based alignment in the CSI work.
- The signal matters more than the model. Having hit the information ceiling of RSSI, the natural next step was a richer physical-layer measurement, leading directly to the CSI localization framework, where the same shift problem is attacked with the full channel response.
Artifacts
BibTeX
@article{saeed2025mitigating,
  author  = {Saeed, M. T. M. and Yousif, M. A. A. and Ozturk, I.},
  title   = {Mitigating Device Heterogeneity for Enhanced Indoor Positioning
             System Performance Using Deep Feature Learning},
  journal = {IEEE Access},
  year    = {2025},
  doi     = {10.1109/ACCESS.2025.3621505}
}